#스터디 시작
EKS Autoscaling은 Amazon EKS 클러스터에서 워커 노드의 수를 자동으로 조절하는 기능입니다. 클러스터의 리소스 사용량에 따라 워커 노드를 추가하거나 제거하여 클러스터 용량을 효율적으로 관리할 수 있습니다. 따라서 이번 스터디에서는 HPA 및 VPA 사용과 EKS Autoscaling 최적화 전략 등을 배우면서 eks의 비용절감 및 성능 향상 등 여러 장점을 배울 수 있을 것입니다.
#사전준비
- Amazon EKS (myeks) 윈클릭 배포 & 기본 설정
# YAML 파일 다운로드
curl -O https://s3.ap-northeast-2.amazonaws.com/cloudformation.cloudneta.net/K8S/eks-oneclick4.yaml

# CloudFormation 스택 배포
예시) aws cloudformation deploy --template-file eks-oneclick4.yaml --stack-name myeks --parameter-overrides KeyName=stem SgIngressSshCidr=$(curl -s ipinfo.io/ip)/32  MyIamUserAccessKeyID=AKIA5... MyIamUserSecretAccessKey='CVNa2...' ClusterBaseName=myeks --region ap-northeast-2

# CloudFormation 스택 배포 완료 후 작업용 EC2 IP 출력
aws cloudformation describe-stacks --stack-name myeks --query 'Stacks[*].Outputs[0].OutputValue' --output text

# 작업용 EC2 SSH 접속
ssh -i ~/.ssh/stem.pem ec2-user@$(aws cloudformation describe-stacks --stack-name myeks --query 'Stacks[*].Outputs[0].OutputValue' --output text)
or
ssh -i ~/.ssh/stem.pem root@$(aws cloudformation describe-stacks --stack-name myeks --query 'Stacks[*].Outputs[0].OutputValue' --output text)
- 기본 설정
# default 네임스페이스 적용
kubectl ns default
# 노드 정보 확인 : t3.medium
kubectl get node --label-columns=node.kubernetes.io/instance-type,eks.amazonaws.com/capacityType,topology.kubernetes.io/zone
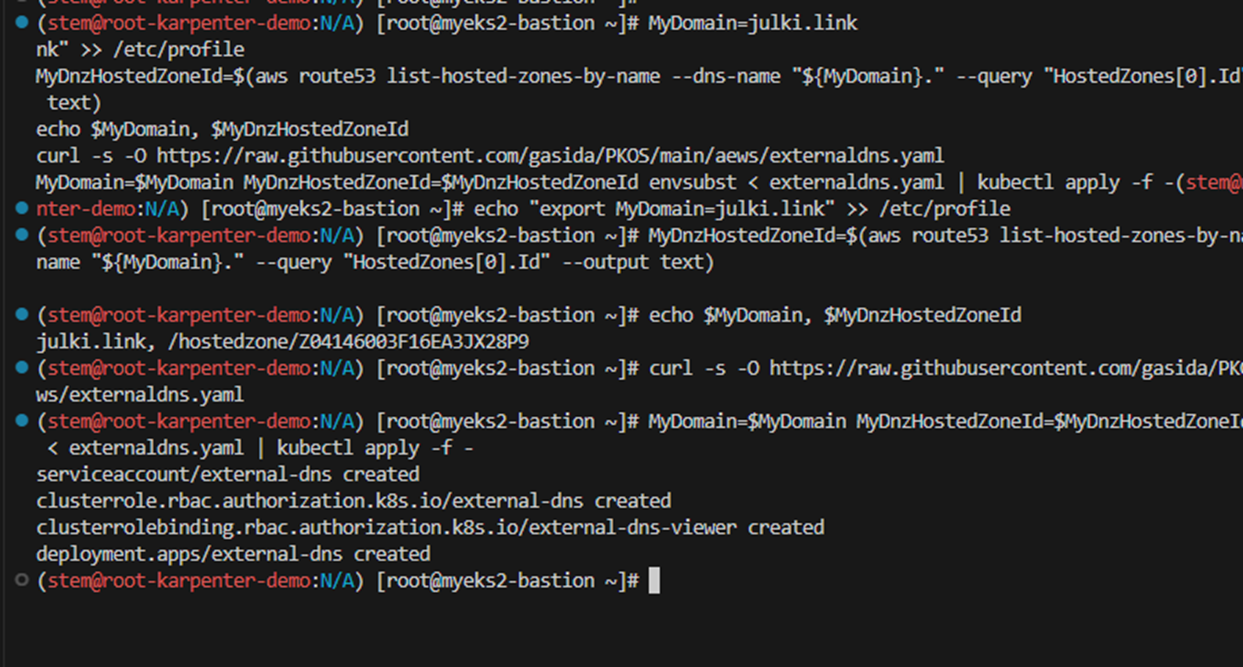
# ExternalDNS
MyDomain=<자신의 도메인>
echo "export MyDomain=<자신의 도메인>" >> /etc/profile
MyDomain=julki.link
echo "export MyDomain=julki.link" >> /etc/profile
MyDnzHostedZoneId=$(aws route53 list-hosted-zones-by-name --dns-name "${MyDomain}." --query "HostedZones[0].Id" --output text)
echo $MyDomain, $MyDnzHostedZoneId
curl -s -O https://raw.githubusercontent.com/gasida/PKOS/main/aews/externaldns.yaml
MyDomain=$MyDomain MyDnzHostedZoneId=$MyDnzHostedZoneId envsubst < externaldns.yaml | kubectl apply -f -
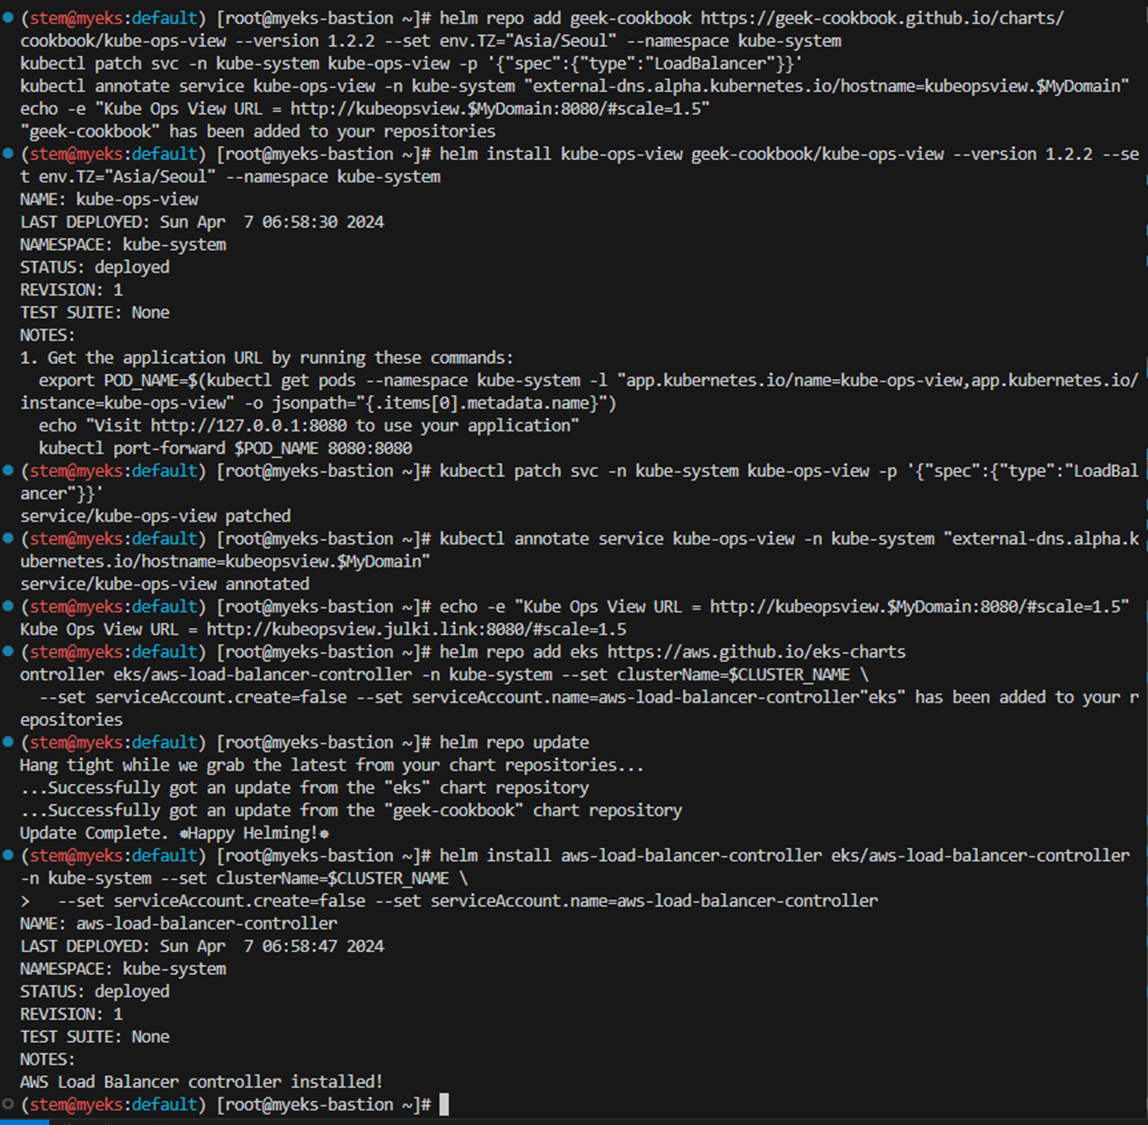
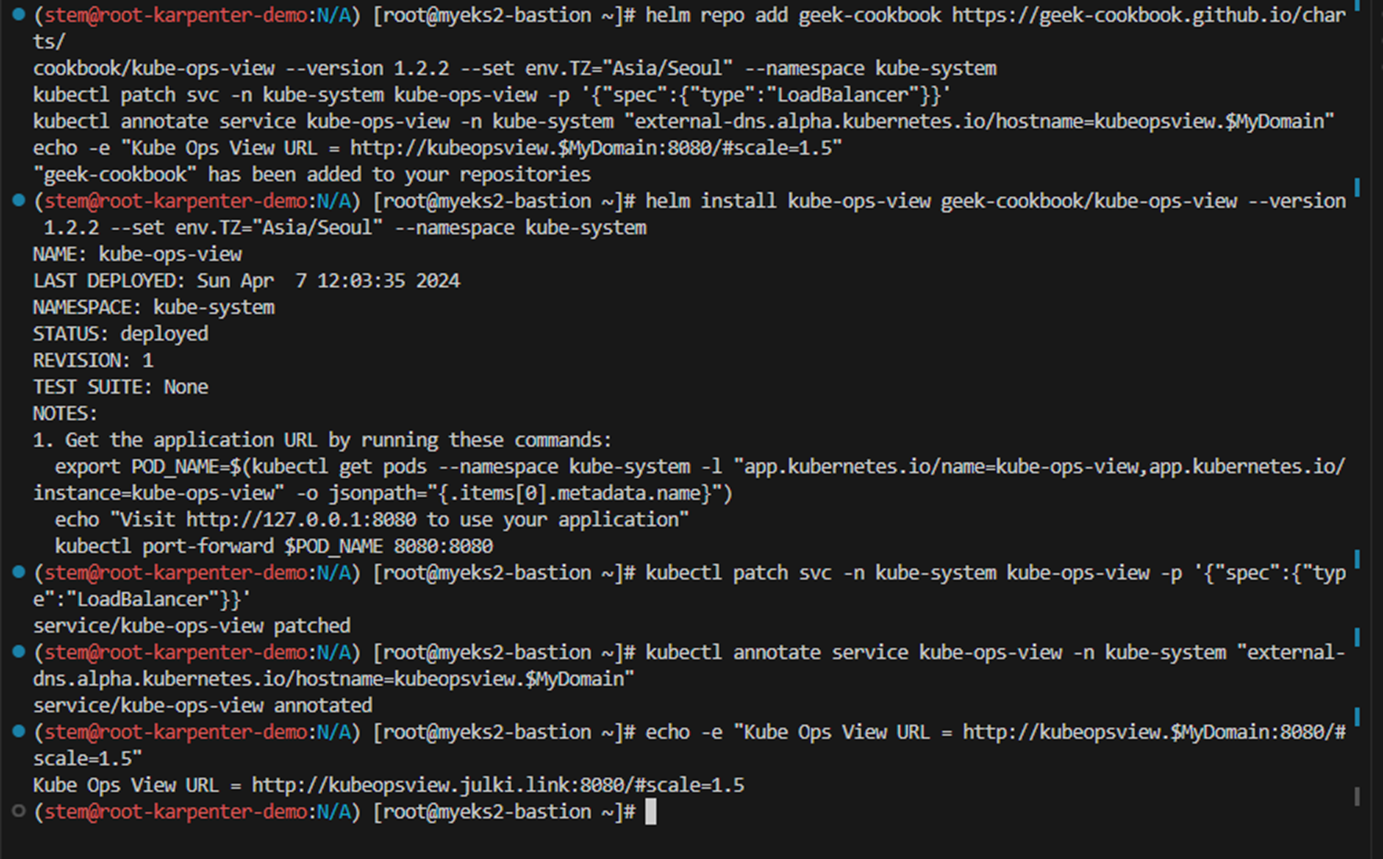
# kube-ops-view
helm repo add geek-cookbook https://geek-cookbook.github.io/charts/
helm install kube-ops-view geek-cookbook/kube-ops-view --version 1.2.2 --set env.TZ="Asia/Seoul" --namespace kube-system
kubectl patch svc -n kube-system kube-ops-view -p '{"spec":{"type":"LoadBalancer"}}'
kubectl annotate service kube-ops-view -n kube-system "external-dns.alpha.kubernetes.io/hostname=kubeopsview.$MyDomain"
echo -e "Kube Ops View URL = http://kubeopsview.$MyDomain:8080/#scale=1.5"
# AWS LB Controller
helm repo add eks https://aws.github.io/eks-charts
helm repo update
helm install aws-load-balancer-controller eks/aws-load-balancer-controller -n kube-system --set clusterName=$CLUSTER_NAME \
--set serviceAccount.create=false --set serviceAccount.name=aws-load-balancer-controller
# gp3 스토리지 클래스 생성
kubectl apply -f https://raw.githubusercontent.com/gasida/PKOS/main/aews/gp3-sc.yaml
# 노드 보안그룹 ID 확인
NGSGID=$(aws ec2 describe-security-groups --filters Name=group-name,Values=*ng1* --query "SecurityGroups[*].[GroupId]" --output text)
aws ec2 authorize-security-group-ingress --group-id $NGSGID --protocol '-1' --cidr 192.168.1.100/32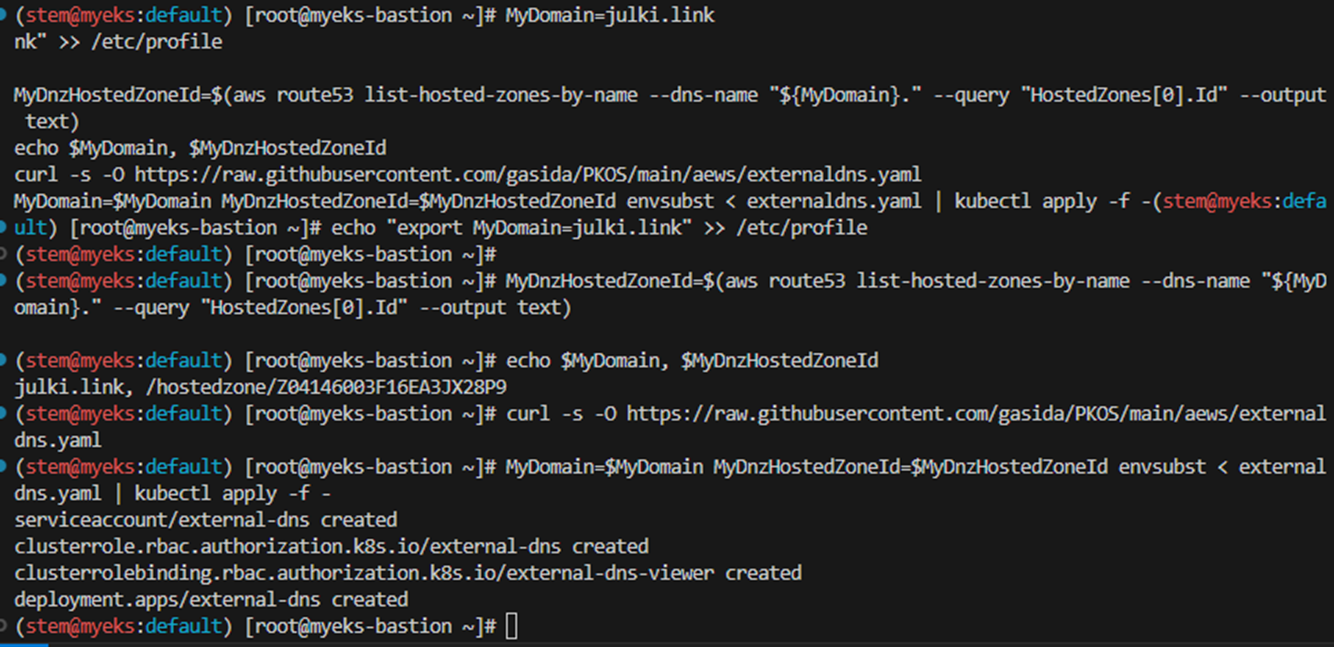

- 프로메테우스 & 그라파나(admin / prom-operator) 설치
# 사용 리전의 인증서 ARN 확인
CERT_ARN=`aws acm list-certificates --query 'CertificateSummaryList[].CertificateArn[]' --output text`
echo $CERT_ARN

# repo 추가
helm repo add prometheus-community https://prometheus-community.github.io/helm-charts

# 파라미터 파일 생성 : PV/PVC(AWS EBS) 삭제에 불편하니, 4주차 실습과 다르게 PV/PVC 미사용
cat <<EOT > monitor-values.yaml
prometheus:
  prometheusSpec:
    podMonitorSelectorNilUsesHelmValues: false
    serviceMonitorSelectorNilUsesHelmValues: false
    retention: 5d
    retentionSize: "10GiB"

  verticalPodAutoscaler:
    enabled: true

  ingress:
    enabled: true
    ingressClassName: alb
    hosts:
      - prometheus.$MyDomain
    paths:
      - /*
    annotations:
      alb.ingress.kubernetes.io/scheme: internet-facing
      alb.ingress.kubernetes.io/target-type: ip
      alb.ingress.kubernetes.io/listen-ports: '[{"HTTPS":443}, {"HTTP":80}]'
      alb.ingress.kubernetes.io/certificate-arn: $CERT_ARN
      alb.ingress.kubernetes.io/success-codes: 200-399
      alb.ingress.kubernetes.io/load-balancer-name: myeks-ingress-alb
      alb.ingress.kubernetes.io/group.name: study
      alb.ingress.kubernetes.io/ssl-redirect: '443'

grafana:
  defaultDashboardsTimezone: Asia/Seoul
  adminPassword: prom-operator
  defaultDashboardsEnabled: false

  ingress:
    enabled: true
    ingressClassName: alb
    hosts:
      - grafana.$MyDomain
    paths:
      - /*
    annotations:
      alb.ingress.kubernetes.io/scheme: internet-facing
      alb.ingress.kubernetes.io/target-type: ip
      alb.ingress.kubernetes.io/listen-ports: '[{"HTTPS":443}, {"HTTP":80}]'
      alb.ingress.kubernetes.io/certificate-arn: $CERT_ARN
      alb.ingress.kubernetes.io/success-codes: 200-399
      alb.ingress.kubernetes.io/load-balancer-name: myeks-ingress-alb
      alb.ingress.kubernetes.io/group.name: study
      alb.ingress.kubernetes.io/ssl-redirect: '443'

kube-state-metrics:
  rbac:
    extraRules:
      - apiGroups: ["autoscaling.k8s.io"]
        resources: ["verticalpodautoscalers"]
        verbs: ["list", "watch"]
  prometheus:
    monitor:
      enabled: true
  customResourceState:
    enabled: true
    config:
      kind: CustomResourceStateMetrics
      spec:
        resources:
          - groupVersionKind:
              group: autoscaling.k8s.io
              kind: "VerticalPodAutoscaler"
              version: "v1"
            labelsFromPath:
              verticalpodautoscaler: [metadata, name]
              namespace: [metadata, namespace]
              target_api_version: [apiVersion]
              target_kind: [spec, targetRef, kind]
              target_name: [spec, targetRef, name]
            metrics:
              - name: "vpa_containerrecommendations_target"
                help: "VPA container recommendations for memory."
                each:
                  type: Gauge
                  gauge:
                    path: [status, recommendation, containerRecommendations]
                    valueFrom: [target, memory]
                    labelsFromPath:
                      container: [containerName]
                commonLabels:
                  resource: "memory"
                  unit: "byte"
              - name: "vpa_containerrecommendations_target"
                help: "VPA container recommendations for cpu."
                each:
                  type: Gauge
                  gauge:
                    path: [status, recommendation, containerRecommendations]
                    valueFrom: [target, cpu]
                    labelsFromPath:
                      container: [containerName]
                commonLabels:
                  resource: "cpu"
                  unit: "core"
  selfMonitor:
    enabled: true

alertmanager:
  enabled: false
EOT
cat monitor-values.yaml | yh

# 배포
kubectl create ns monitoring
helm install kube-prometheus-stack prometheus-community/kube-prometheus-stack --version 57.2.0 \
--set prometheus.prometheusSpec.scrapeInterval='15s' --set prometheus.prometheusSpec.evaluationInterval='15s' \
-f monitor-values.yaml --namespace monitoring

# Metrics-server 배포
kubectl apply -f https://github.com/kubernetes-sigs/metrics-server/releases/latest/download/components.yaml

# 프로메테우스 ingress 도메인으로 웹 접속
echo -e "Prometheus Web URL = https://prometheus.$MyDomain"

# 그라파나 웹 접속 : 기본 계정 - admin / prom-operator
echo -e "Grafana Web URL = https://grafana.$MyDomain"


#EKS Autoscaling

Kubernetes Cluster Autoscaler는 널리 사용되는 Cluster Autoscaling 솔루션입니다 . 리소스를 낭비하지 않고 포드를 예약할 수 있는 충분한 노드가 클러스터에 있는지 확인하는 역할을 합니다. 예약에 실패한 포드와 활용도가 낮은 노드를 감시합니다. 그런 다음 클러스터에 변경 사항을 적용하기 전에 노드 추가 또는 제거를 시뮬레이션합니다. Cluster Autoscaler 내의 AWS 클라우드 공급자 구현은 .DesiredReplicasEC2 Auto Scaling 그룹의 필드를 제어합니다.

Kubernetes는 Cluster Autoscaler비용을 절감하고 Kubernetes 클러스터의 성능을 향상시키는 데 도움이 되는 강력한 도구입니다. Cluster Autoscaler는 워크로드 수요에 따라 클러스터의 노드 수를 자동으로 확장함으로써 비용 낭비로 이어질 수 있는 과도한 리소스 프로비저닝을 방지하는 데 도움이 됩니다.또한 Cluster Autoscaler는 포드가 최고 성능으로 실행하는 데 필요한 리소스를 갖도록 보장할 수 있습니다.
Cluster Autoscaler는 Pod의 리소스 요청에 따라 클러스터의 노드 수를 자동으로 확장하는 Kubernetes 추가 기능입니다. CPU 또는 메모리 사용량을 직접 측정하지 않고 대신 보류 상태의 Pod를 확인합니다. 즉, 기존 노드에서 실행되도록 예약할 수 없습니다. CA가 보류 중인 포드를 감지하면 모든 포드가 예약될 때까지 클러스터에 새 노드를 추가합니다.
#EKS Autoscaling 실습
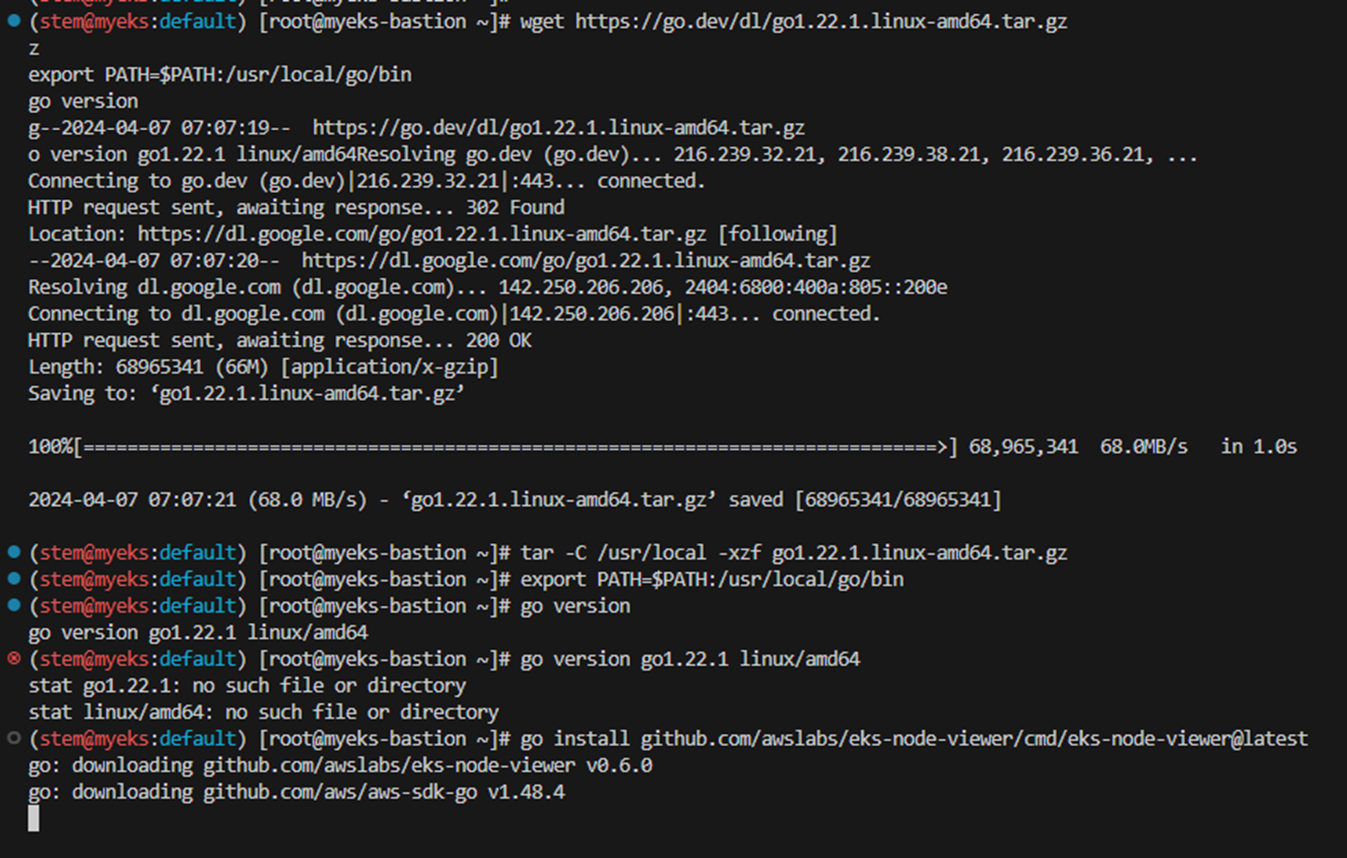
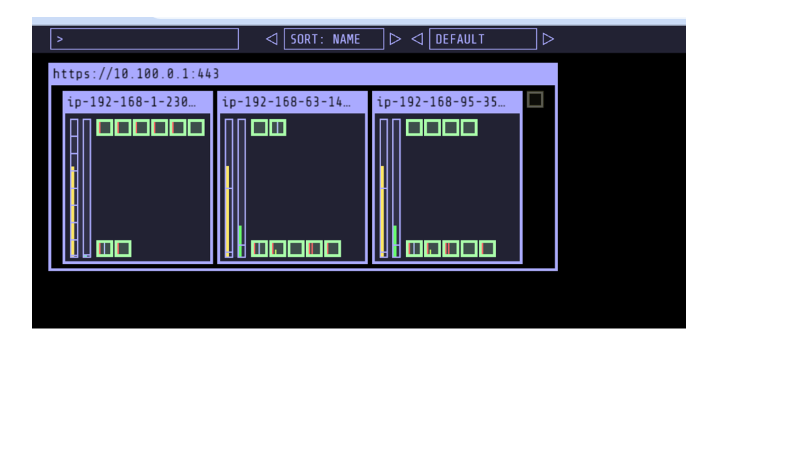
- EKS Node Viewer 설치 : 노드 할당 가능 용량과 요청 request 리소스 표시, 실제 파드 리소스 사용량 X
# go 설치
wget https://go.dev/dl/go1.22.1.linux-amd64.tar.gz
tar -C /usr/local -xzf go1.22.1.linux-amd64.tar.gz
export PATH=$PATH:/usr/local/go/bin
go version
go version go1.22.1 linux/amd64

# EKS Node Viewer 설치 : 약 2분 이상 소요
go install github.com/awslabs/eks-node-viewer/cmd/eks-node-viewer@latest

# [신규 터미널] EKS Node Viewer 접속
cd ~/go/bin && ./eks-node-viewer
혹은
cd ~/go/bin && ./eks-node-viewer --resources cpu,memory

명령 샘플
# Standard usage
./eks-node-viewer

# Display both CPU and Memory Usage
./eks-node-viewer --resources cpu,memory

# Karenter nodes only
./eks-node-viewer --node-selector "karpenter.sh/provisioner-name"

# Display extra labels, i.e. AZ
./eks-node-viewer --extra-labels topology.kubernetes.io/zone

# Specify a particular AWS profile and region
AWS_PROFILE=myprofile AWS_REGION=us-west-2

기본 옵션
# select only Karpenter managed nodes
node-selector=karpenter.sh/provisioner-name

# display both CPU and memory
resources=cpu,memory
EKS 노드 뷰어는 Kubernetes 클러스터 내에서 동적 노드 사용량을 시각화하기 위한 도구입니다. 원래는 Karpenter 와의 통합을 시연하기 위해 AWS에서 내부 도구로 개발되었지만 이제는 오픈 소스 프로젝트로 대중에게 제공됩니다.
EKS 노드 뷰어는 예약된 포드 리소스 요청과 노드에서 할당 가능한 용량을 표시합니다. 이 정보는 활용도가 낮거나 과도하게 활용되는 노드를 식별하고 노드 확장 및 통합에 대한 결정을 내리는 데 사용될 수 있습니다.
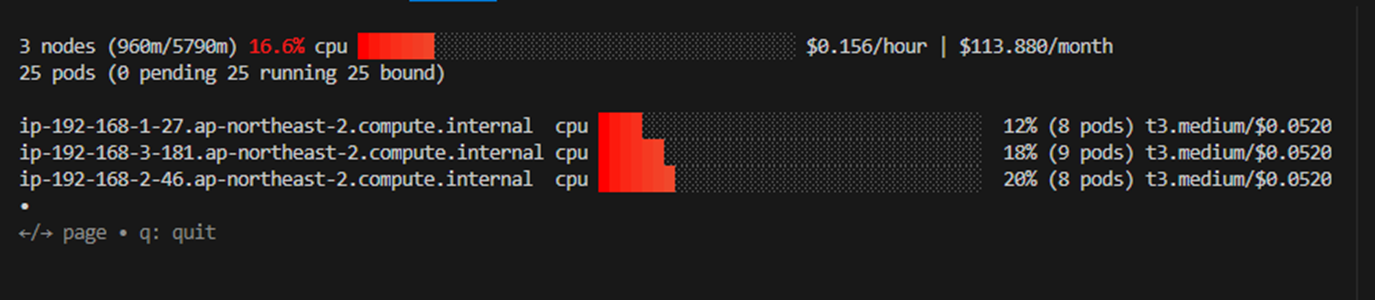
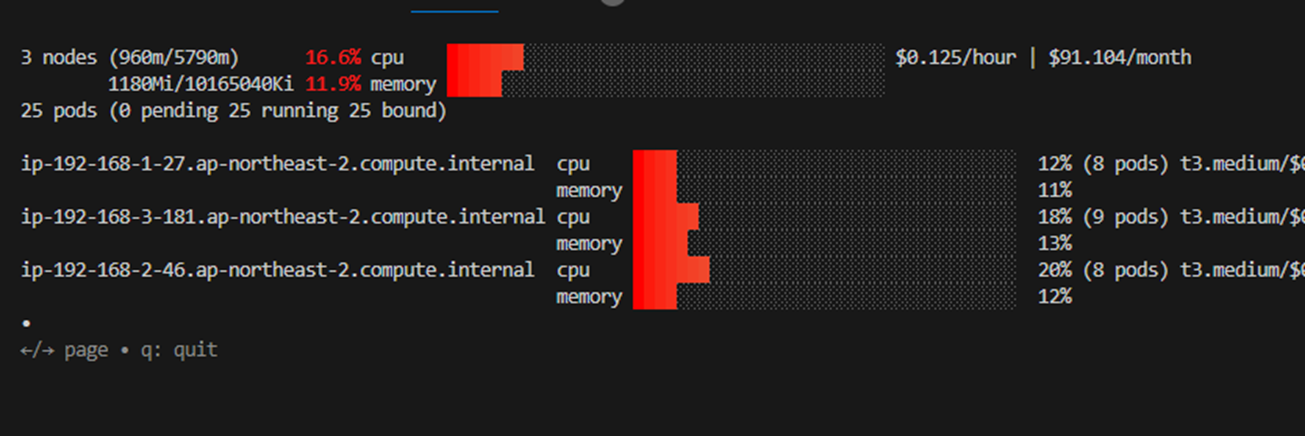
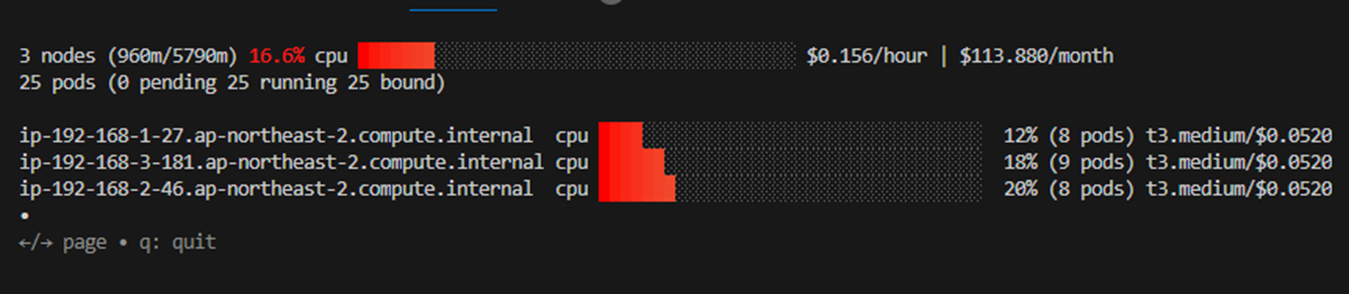
EKS 노드 뷰어는 Kubernetes 클러스터의 효율성과 성능을 향상시키는 데 사용할 수 있는 간단하지만 강력한 도구입니다. 사용 및 설치가 쉽고 노드 사용량에 대한 명확하고 간결한 보기를 제공합니다. 실제 Pod 리소스 사용량은 확인하지 않습니다.
2. HPA - Horizontal Pod Autoscaler
17125_rev1.json : 대시보드 → Import : JSON
{
"__inputs": [],
"__requires": [
{
"type": "grafana",
"id": "grafana",
"name": "Grafana",
"version": "6.1.6"
},
{
"type": "panel",
"id": "graph",
"name": "Graph",
"version": ""
},
{
"type": "datasource",
"id": "prometheus",
"name": "Prometheus",
"version": "1.0.0"
},
{
"type": "panel",
"id": "singlestat",
"name": "Singlestat",
"version": ""
}
],
"annotations": {
"list": [
{
"builtIn": 1,
"datasource": "-- Grafana --",
"enable": true,
"hide": true,
"iconColor": "rgba(0, 211, 255, 1)",
"name": "Annotations & Alerts",
"type": "dashboard"
}
]
},
"editable": true,
"gnetId": 17125,
"graphTooltip": 0,
"id": null,
"iteration": 1558717029334,
"links": [],
"panels": [
{
"cacheTimeout": null,
"colorBackground": false,
"colorValue": false,
"colors": [
"#299c46",
"rgba(237, 129, 40, 0.89)",
"#d44a3a"
],
"datasource": "$datasource",
"format": "none",
"gauge": {
"maxValue": 100,
"minValue": 0,
"show": false,
"thresholdLabels": false,
"thresholdMarkers": true
},
"id": 5,
"interval": null,
"links": [],
"mappingType": 1,
"mappingTypes": [
{
"name": "value to text",
"value": 1
},
{
"name": "range to text",
"value": 2
}
],
"maxDataPoints": 100,
"nullPointMode": "connected",
"nullText": null,
"postfix": "",
"postfixFontSize": "50%",
"prefix": "",
"prefixFontSize": "50%",
"rangeMaps": [
{
"from": "null",
"text": "N/A",
"to": "null"
}
],
"sparkline": {
"fillColor": "rgba(31, 118, 189, 0.18)",
"full": false,
"lineColor": "rgb(31, 120, 193)",
"show": true
},
"tableColumn": "",
"targets": [
{
"expr": "kube_horizontalpodautoscaler_status_desired_replicas{job=\"kube-state-metrics\", namespace=\"$namespace\"}",
"format": "time_series",
"intervalFactor": 2,
"legendFormat": "",
"refId": "A"
}
],
"thresholds": "",
"title": "Desired Replicas",
"type": "singlestat",
"valueFontSize": "80%",
"valueMaps": [
{
"op": "=",
"text": "0",
"value": "null"
}
],
"valueName": "current"
},
{
"cacheTimeout": null,
"colorBackground": false,
"colorValue": false,
"colors": [
"#299c46",
"rgba(237, 129, 40, 0.89)",
"#d44a3a"
],
"datasource": "$datasource",
"format": "none",
"gauge": {
"maxValue": 100,
"minValue": 0,
"show": false,
"thresholdLabels": false,
"thresholdMarkers": true
},
"gridPos": {
"h": 3,
"w": 6,
"x": 6,
"y": 0
},
"id": 6,
"interval": null,
"links": [],
"mappingType": 1,
"mappingTypes": [
{
"name": "value to text",
"value": 1
},
{
"name": "range to text",
"value": 2
}
],
"maxDataPoints": 100,
"nullPointMode": "connected",
"nullText": null,
"postfix": "",
"postfixFontSize": "50%",
"prefix": "",
"prefixFontSize": "50%",
"rangeMaps": [
{
"from": "null",
"text": "N/A",
"to": "null"
}
],
"sparkline": {
"fillColor": "rgba(31, 118, 189, 0.18)",
"full": false,
"lineColor": "rgb(31, 120, 193)",
"show": true
},
"tableColumn": "",
"targets": [
{
"expr": "kube_horizontalpodautoscaler_status_current_replicas{job=\"kube-state-metrics\", namespace=\"$namespace\"}",
"format": "time_series",
"intervalFactor": 2,
"legendFormat": "",
"refId": "A"
}
],
"thresholds": "",
"title": "Current Replicas",
"type": "singlestat",
"valueFontSize": "80%",
"valueMaps": [
{
"op": "=",
"text": "0",
"value": "null"
}
],
"valueName": "current"
},
{
"cacheTimeout": null,
"colorBackground": false,
"colorValue": false,
"colors": [
"#299c46",
"rgba(237, 129, 40, 0.89)",
"#d44a3a"
],
"datasource": "$datasource",
"format": "none",
"gauge": {
"maxValue": 100,
"minValue": 0,
"show": false,
"thresholdLabels": false,
"thresholdMarkers": true
},
"gridPos": {
"h": 3,
"w": 6,
"x": 12,
"y": 0
},
"id": 7,
"interval": null,
"links": [],
"mappingType": 1,
"mappingTypes": [
{
"name": "value to text",
"value": 1
},
{
"name": "range to text",
"value": 2
}
],
"maxDataPoints": 100,
"nullPointMode": "connected",
"nullText": null,
"postfix": "",
"postfixFontSize": "50%",
"prefix": "",
"prefixFontSize": "50%",
"rangeMaps": [
{
"from": "null",
"text": "N/A",
"to": "null"
}
],
"sparkline": {
"fillColor": "rgba(31, 118, 189, 0.18)",
"full": false,
"lineColor": "rgb(31, 120, 193)",
"show": false
},
"tableColumn": "",
"targets": [
{
"expr": "kube_horizontalpodautoscaler_spec_min_replicas{job=\"kube-state-metrics\", namespace=\"$namespace\"}",
"format": "time_series",
"intervalFactor": 2,
"legendFormat": "",
"refId": "A"
}
],
"thresholds": "",
"title": "Min Replicas",
"type": "singlestat",
"valueFontSize": "80%",
"valueMaps": [
{
"op": "=",
"text": "0",
"value": "null"
}
],
"valueName": "current"
},
{
"cacheTimeout": null,
"colorBackground": false,
"colorValue": false,
"colors": [
"#299c46",
"rgba(237, 129, 40, 0.89)",
"#d44a3a"
],
"datasource": "$datasource",
"format": "none",
"gauge": {
"maxValue": 100,
"minValue": 0,
"show": false,
"thresholdLabels": false,
"thresholdMarkers": true
},
"gridPos": {
"h": 3,
"w": 6,
"x": 18,
"y": 0
},
"id": 8,
"interval": null,
"links": [],
"mappingType": 1,
"mappingTypes": [
{
"name": "value to text",
"value": 1
},
{
"name": "range to text",
"value": 2
}
],
"maxDataPoints": 100,
"nullPointMode": "connected",
"nullText": null,
"postfix": "",
"postfixFontSize": "50%",
"prefix": "",
"prefixFontSize": "50%",
"rangeMaps": [
{
"from": "null",
"text": "N/A",
"to": "null"
}
],
"sparkline": {
"fillColor": "rgba(31, 118, 189, 0.18)",
"full": false,
"lineColor": "rgb(31, 120, 193)",
"show": false
},
"tableColumn": "",
"targets": [
{
"expr": "kube_horizontalpodautoscaler_spec_max_replicas{job=\"kube-state-metrics\"}",
"format": "time_series",
"intervalFactor": 2,
"legendFormat": "",
"refId": "A"
}
],
"thresholds": "",
"title": "Max Replicas",
"type": "singlestat",
"valueFontSize": "80%",
"valueMaps": [
{
"op": "=",
"text": "0",
"value": "null"
}
],
"valueName": "current"
},
{
"aliasColors": {},
"bars": false,
"dashLength": 10,
"dashes": false,
"datasource": "$datasource",
"fill": 0,
"gridPos": {
"h": 12,
"w": 24,
"x": 0,
"y": 3
},
"id": 9,
"legend": {
"alignAsTable": false,
"avg": false,
"current": false,
"max": false,
"min": false,
"rightSide": false,
"show": true,
"total": false,
"values": false
},
"lines": true,
"linewidth": 1,
"links": [],
"nullPointMode": "null",
"paceLength": 10,
"percentage": false,
"pointradius": 5,
"points": false,
"renderer": "flot",
"repeat": null,
"seriesOverrides": [
{
"alias": "Max",
"color": "#C4162A"
},
{
"alias": "Min",
"color": "#1F60C4"
}
],
"spaceLength": 10,
"stack": false,
"steppedLine": false,
"targets": [
{
"expr": "kube_horizontalpodautoscaler_status_desired_replicas{job=\"kube-state-metrics\",namespace=\"$namespace\"}",
"format": "time_series",
"intervalFactor": 2,
"legendFormat": "Desired",
"refId": "B"
},
{
"expr": "kube_horizontalpodautoscaler_status_current_replicas{job=\"kube-state-metrics\",namespace=\"$namespace\"}",
"format": "time_series",
"intervalFactor": 2,
"legendFormat": "Running",
"refId": "C"
},
{
"expr": "kube_horizontalpodautoscaler_spec_max_replicas{job=\"kube-state-metrics\",namespace=\"$namespace\"}",
"format": "time_series",
"instant": false,
"intervalFactor": 2,
"legendFormat": "Max",
"refId": "A"
},
{
"expr": "kube_horizontalpodautoscaler_spec_min_replicas{job=\"kube-state-metrics\",namespace=\"$namespace\"}",
"format": "time_series",
"instant": false,
"intervalFactor": 2,
"legendFormat": "Min",
"refId": "D"
}
],
"thresholds": [],
"timeFrom": null,
"timeRegions": [],
"timeShift": null,
"title": "Replicas",
"tooltip": {
"shared": true,
"sort": 0,
"value_type": "individual"
},
"type": "graph",
"xaxis": {
"buckets": null,
"mode": "time",
"name": null,
"show": true,
"values": []
},
"yaxes": [
{
"format": "short",
"label": null,
"logBase": 1,
"max": null,
"min": null,
"show": true
},
{
"format": "short",
"label": null,
"logBase": 1,
"max": null,
"min": null,
"show": true
}
],
"yaxis": {
"align": false,
"alignLevel": null
}
}
],
"refresh": "10s",
"schemaVersion": 18,
"style": "dark",
"tags": [],
"templating": {
"list": [
{
"current": {
"text": "Prometheus",
"value": "Prometheus"
},
"hide": 0,
"includeAll": false,
"label": null,
"multi": false,
"name": "datasource",
"options": [],
"query": "prometheus",
"refresh": 1,
"regex": "",
"skipUrlSync": false,
"type": "datasource"
},
{
"allValue": null,
"current": {},
"datasource": "$datasource",
"definition": "label_values(kube_horizontalpodautoscaler_metadata_generation{job=\"kube-state-metrics\"}, namespace)",
"hide": 0,
"includeAll": false,
"label": "Namespace",
"multi": false,
"name": "namespace",
"options": [],
"query": "label_values(kube_horizontalpodautoscaler_metadata_generation{job=\"kube-state-metrics\"}, namespace)",
"refresh": 2,
"regex": "",
"skipUrlSync": false,
"sort": 0,
"tagValuesQuery": "",
"tags": [],
"tagsQuery": "",
"type": "query",
"useTags": false
},
{
"allValue": null,
"current": {},
"datasource": "$datasource",
"definition": "label_values(kube_horizontalpodautoscaler_labels{job=\"kube-state-metrics\", namespace=\"$namespace\"}, horizontalpodautoscaler)",
"hide": 0,
"includeAll": false,
"label": "Name",
"multi": false,
"name": "horizontalpodautoscaler",
"options": [],
"query": "label_values(kube_horizontalpodautoscaler_labels{job=\"kube-state-metrics\", namespace=\"$namespace\"}, horizontalpodautoscaler)",
"refresh": 2,
"regex": "",
"skipUrlSync": false,
"sort": 0,
"tagValuesQuery": "",
"tags": [],
"tagsQuery": "",
"type": "query",
"useTags": false
}
]
},
"time": {
"from": "now-1h",
"to": "now"
},
"timepicker": {
"refresh_intervals": [
"5s",
"10s",
"30s",
"1m",
"5m",
"15m",
"30m",
"1h",
"2h",
"1d"
],
"time_options": [
"5m",
"15m",
"1h",
"6h",
"12h",
"24h",
"2d",
"7d",
"30d"
]
},
"timezone": "",
"title": "Kubernetes / Horizontal Pod Autoscaler",
"uid": "alJY6yWZz",
"version": 10,
"description": "A quick and simple dashboard for viewing how your horizontal pod autoscaler is doing."
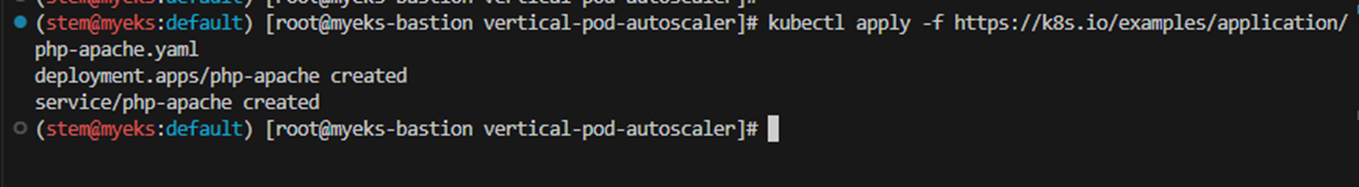
}# Run and expose php-apache server
curl -s -O https://raw.githubusercontent.com/kubernetes/website/main/content/en/examples/application/php-apache.yaml
cat php-apache.yaml | yh
kubectl apply -f php-apache.yaml
# 확인
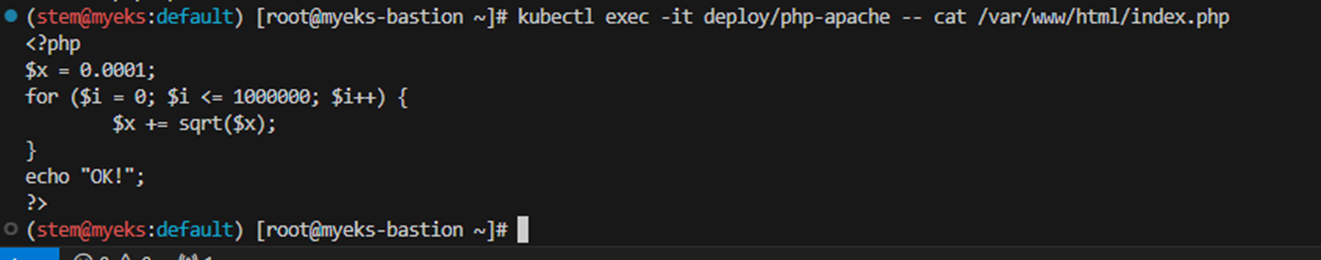
kubectl exec -it deploy/php-apache -- cat /var/www/html/index.php
...
# 모니터링 : 터미널2개 사용
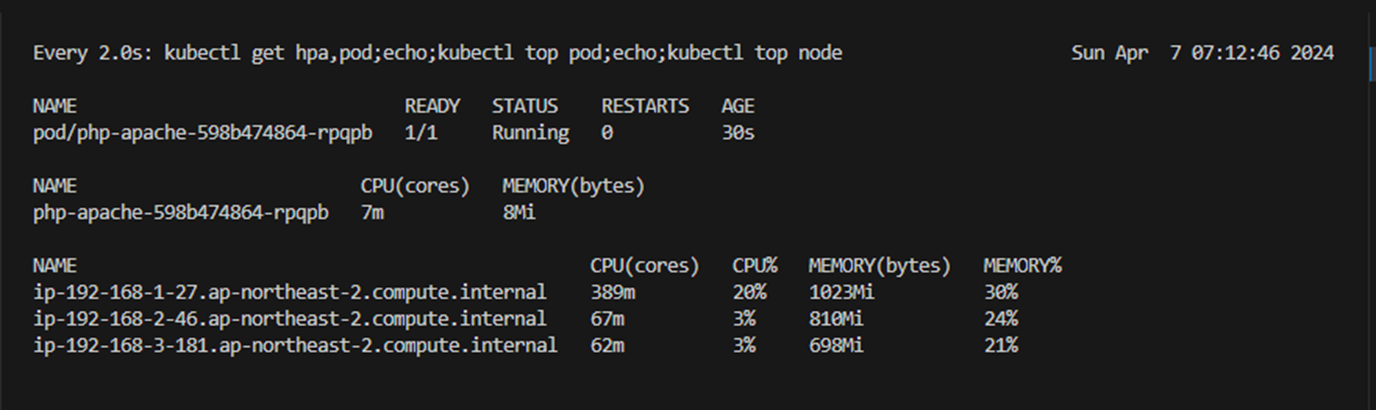
watch -d 'kubectl get hpa,pod;echo;kubectl top pod;echo;kubectl top node'
kubectl exec -it deploy/php-apache -- top
# 접속
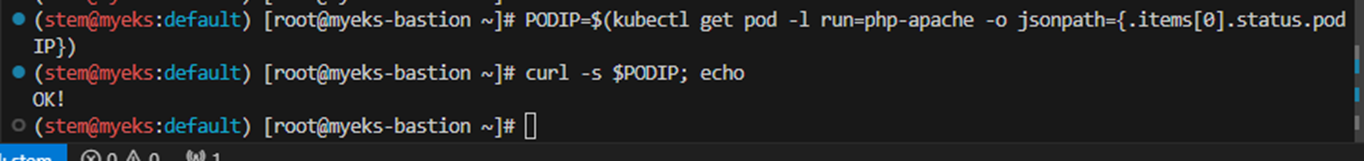
PODIP=$(kubectl get pod -l run=php-apache -o jsonpath={.items[0].status.podIP})
curl -s $PODIP; echo
아파치 웹서버란, 고성능의 HTTP 서버이며, 정식 이름은 아파치 HTTP 서버(Apache HTTP Server)지만 아파치 서버로 많이 알려져 있습니다. 프로그램의 이름은 HTTPd이며 HTTP 데몬(daemon)이라는 의미입니다. 안정성과 확장성, 호환성이 매우좋고, 개선된 패치파일을 꾸준하게 제공하고 있었기 때문에 웹 서버용 소프트웨어로 전 세계에서 가장 높은 점유율을 가지고 있습니다. 세계에서 가장 많이 쓰는 웹 서버 중 하나이며, 오픈소스 소프트웨어 그룹인 아파치 소프트웨어 재단에서 만든 HTTP 웹 서버 입니다.

- HPA 생성 및 부하 발생 후 오토 스케일링 테스트 : 증가 시 기본 대기 시간(30초), 감소 시 기본 대기 시간(5분) → 조정 가능
# Create the HorizontalPodAutoscaler : requests.cpu=200m - 알고리즘
# Since each pod requests 200 milli-cores by kubectl run, this means an average CPU usage of 100 milli-cores.
kubectl autoscale deployment php-apache --cpu-percent=50 --min=1 --max=10
kubectl describe hpa
...
Metrics: ( current / target )
resource cpu on pods (as a percentage of request): 0% (1m) / 50%
Min replicas: 1
Max replicas: 10
Deployment pods: 1 current / 1 desired
...
# HPA 설정 확인
kubectl get hpa php-apache -o yaml | kubectl neat | yh
spec:
minReplicas: 1 # [4] 또는 최소 1개까지 줄어들 수도 있습니다
maxReplicas: 10 # [3] 포드를 최대 5개까지 늘립니다
scaleTargetRef:
apiVersion: apps/v1
kind: Deployment
name: php-apache # [1] php-apache 의 자원 사용량에서
metrics:
- type: Resource
resource:
name: cpu
target:
type: Utilization
averageUtilization: 50 # [2] CPU 활용률이 50% 이상인 경우
# 반복 접속 1 (파드1 IP로 접속) >> 증가 확인 후 중지
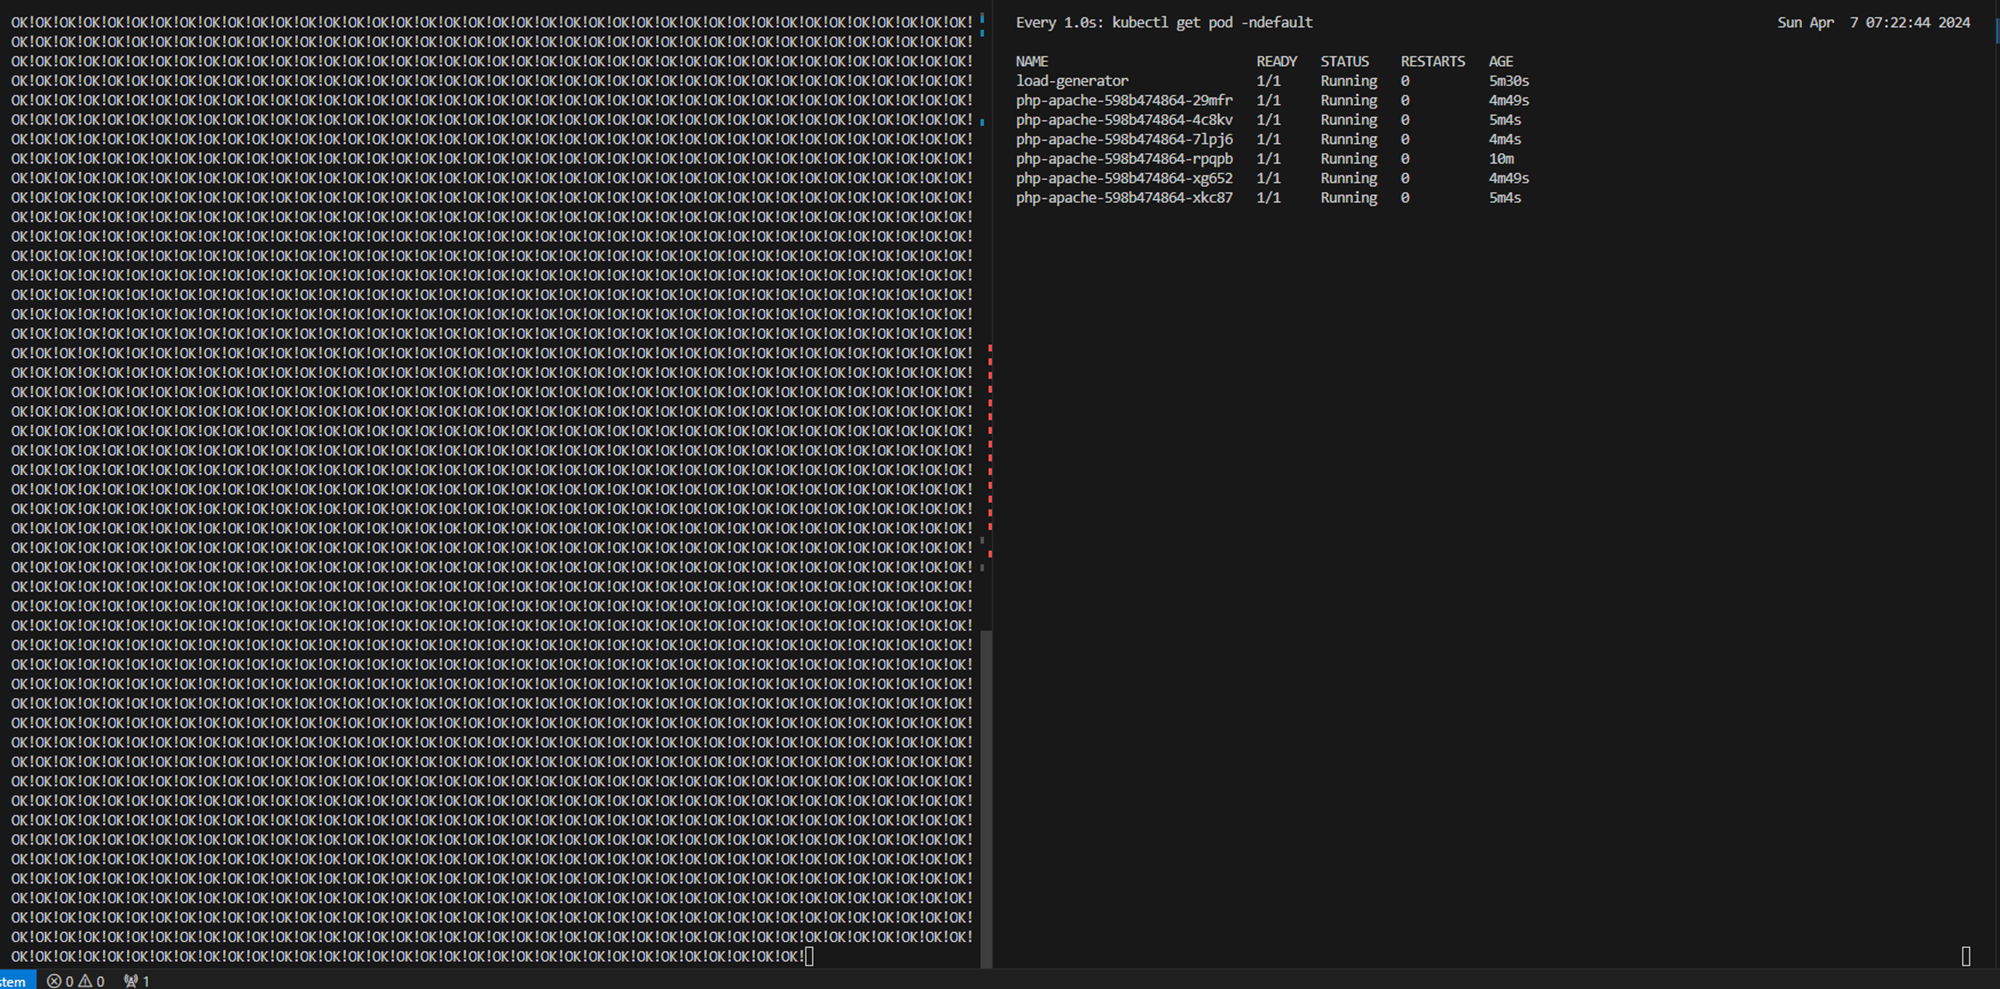
while true;do curl -s $PODIP; sleep 0.5; done
# 반복 접속 2 (서비스명 도메인으로 파드들 분산 접속) >> 증가 확인(몇개까지 증가되는가? 그 이유는?) 후 중지 >> 중지 5분 후 파드 갯수 감소 확인
# Run this in a separate terminal
# so that the load generation continues and you can carry on with the rest of the steps
kubectl run -i --tty load-generator --rm --image=busybox:1.28 --restart=Never -- /bin/sh -c "while sleep 0.01; do wget -q -O- http://php-apache; done"


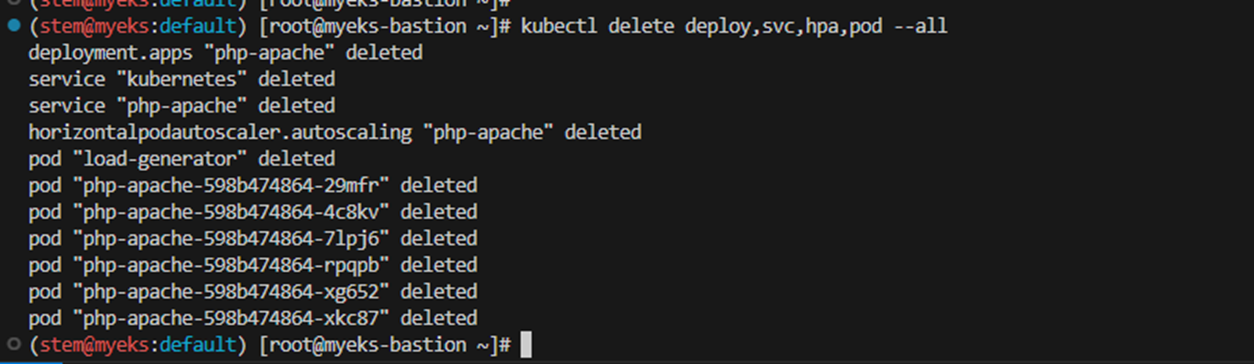
- 오브젝트 삭제: kubectl delete deploy,svc,hpa,pod --all
3. KEDA - Kubernetes based Event Driven Autoscaler
KEDA 는 쿠버네티스 기반 이벤트 기반 자동 확장 처리이며, KEDA를 사용하면 처리해야 하는 이벤트 수에 따라 Kubernetes의 모든 컨테이너 확장을 추진할 수 있습니다.
KEDA는 모든 Kubernetes 클러스터에 추가할 수 있는 단일 목적의 경량 구성 요소입니다. KEDA는 수 평형 포드 자동 확장(Horizontal Pod Autoscaler) 과 같은 표준 Kubernetes 구성 요소와 함께 작동합니다.덮어쓰거나 복제하지 않고 기능을 확장할 수 있습니다. KEDA를 사용하면 이벤트 중심 규모를 사용하려는 앱을 명시적으로 매핑하고 다른 앱은 계속 작동할 수 있습니다. 따라서 KEDA는 다른 Kubernetes 애플리케이션 또는 프레임워크와 함께 실행할 수 있는 유연하고 안전한 옵션입니다.
# KEDA 설치
cat <<EOT > keda-values.yaml
metricsServer:
  useHostNetwork: true

prometheus:
  metricServer:
    enabled: true
    port: 9022
    portName: metrics
    path: /metrics
    serviceMonitor:
      # Enables ServiceMonitor creation for the Prometheus Operator
      enabled: true
    podMonitor:
      # Enables PodMonitor creation for the Prometheus Operator
      enabled: true
  operator:
    enabled: true
    port: 8080
    serviceMonitor:
      # Enables ServiceMonitor creation for the Prometheus Operator
      enabled: true
    podMonitor:
      # Enables PodMonitor creation for the Prometheus Operator
      enabled: true

  webhooks:
    enabled: true
    port: 8080
    serviceMonitor:
      # Enables ServiceMonitor creation for the Prometheus webhooks
      enabled: true
EOT

kubectl create namespace keda
helm repo add kedacore https://kedacore.github.io/charts
helm install keda kedacore/keda --version 2.13.0 --namespace keda -f keda-values.yaml

# KEDA 설치 확인
kubectl get all -n keda
kubectl get validatingwebhookconfigurations keda-admission
kubectl get validatingwebhookconfigurations keda-admission | kubectl neat | yh
kubectl get crd | grep keda

# keda 네임스페이스에 디플로이먼트 생성
kubectl apply -f php-apache.yaml -n keda
kubectl get pod -n keda

# ScaledObject 정책 생성 : cron
cat <<EOT > keda-cron.yaml
apiVersion: keda.sh/v1alpha1
kind: ScaledObject
metadata:
  name: php-apache-cron-scaled
spec:
  minReplicaCount: 0
  maxReplicaCount: 2
  pollingInterval: 30
  cooldownPeriod: 300
  scaleTargetRef:
    apiVersion: apps/v1
    kind: Deployment
    name: php-apache
  triggers:
  - type: cron
    metadata:
      timezone: Asia/Seoul
      start: 00,15,30,45 * * * *
      end: 05,20,35,50 * * * *
      desiredReplicas: "1"
EOT
kubectl apply -f keda-cron.yaml -n keda

# 그라파나 대시보드 추가
# 모니터링
watch -d 'kubectl get ScaledObject,hpa,pod -n keda'
kubectl get ScaledObject -w

# 확인
kubectl get ScaledObject,hpa,pod -n keda
kubectl get hpa -o jsonpath={.items[0].spec} -n keda | jq
...
"metrics": [
    {
      "external": {
        "metric": {
          "name": "s0-cron-Asia-Seoul-00,15,30,45xxxx-05,20,35,50xxxx",
          "selector": {
            "matchLabels": {
              "scaledobject.keda.sh/name": "php-apache-cron-scaled"
            }
          }
        },
        "target": {
          "averageValue": "1",
          "type": "AverageValue"
        }
      },
      "type": "External"
    }

# KEDA 및 deployment 등 삭제
kubectl delete -f keda-cron.yaml -n keda && kubectl delete deploy php-apache -n keda && helm uninstall keda -n keda
kubectl delete namespace keda


4. VPA - Vertical Pod Autoscaler
Kubernetes Vertical Pod Autoscaler는 Pods에 대한 CPU 및 메모리 예약을 자동으로 조정하여 애플리케이션의 ‘크기를 적절히 조정’할 수 있게 지원합니다. 이러한 조정을 통해 클러스터 리소스 사용률을 개선하고 다른 Pods를 위한 CPU 및 메모리를 확보할 수 있습니다. 이 주제에서는 Vertical Pod Autoscaler를 클러스터에 배포하고 제대로 작동하는지 확인하는 방법을 안내합니다.
# 코드 다운로드
git clone https://github.com/kubernetes/autoscaler.git
cd ~/autoscaler/vertical-pod-autoscaler/
tree hack

# openssl 버전 확인
openssl version
OpenSSL 1.0.2k-fips  26 Jan 2017

# openssl 1.1.1 이상 버전 확인
yum install openssl11 -y
openssl11 version
OpenSSL 1.1.1g FIPS  21 Apr 2020

# 스크립트파일내에 openssl11 수정
sed -i 's/openssl/openssl11/g' ~/autoscaler/vertical-pod-autoscaler/pkg/admission-controller/gencerts.sh

# Deploy the Vertical Pod Autoscaler to your cluster with the following command.
watch -d kubectl get pod -n kube-system
cat hack/vpa-up.sh
./hack/vpa-up.sh
kubectl get crd | grep autoscaling
kubectl get mutatingwebhookconfigurations vpa-webhook-config
kubectl get mutatingwebhookconfigurations vpa-webhook-config -o json | jq

- 공식 예제 : pod가 실행되면 약 2~3분 뒤에 pod resource.reqeust가 VPA에 의해 수정 - 링크
- vpa에 spec.updatePolicy.updateMode를 Off 로 변경 시 파드에 Spec을 자동으로 변경 재실행 하지 않습니다. 기본값(Auto)
# 모니터링
watch -d "kubectl top pod;echo "----------------------";kubectl describe pod | grep Requests: -A2"
# 공식 예제 배포
cd ~/autoscaler/vertical-pod-autoscaler/
cat examples/hamster.yaml | yh
kubectl apply -f examples/hamster.yaml && kubectl get vpa -w
# 파드 리소스 Requestes 확인
kubectl describe pod | grep Requests: -A2
Requests:
cpu: 100m
memory: 50Mi
--
Requests:
cpu: 587m
memory: 262144k
--
Requests:
cpu: 587m
memory: 262144k
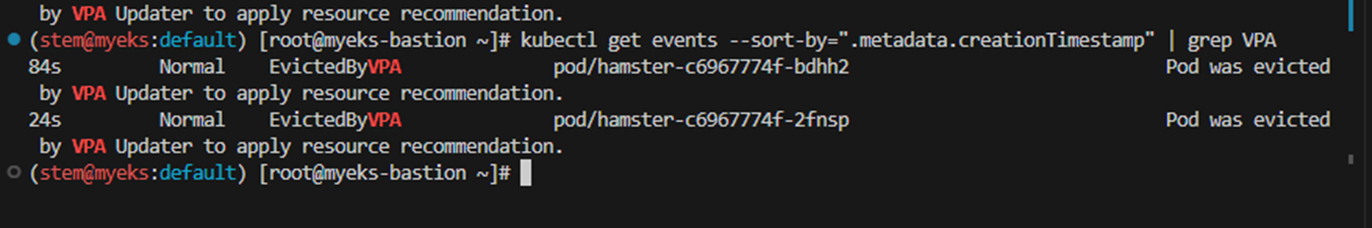
# VPA에 의해 기존 파드 삭제되고 신규 파드가 생성됨
kubectl get events --sort-by=".metadata.creationTimestamp" | grep VPA
2m16s Normal EvictedByVPA pod/hamster-5bccbb88c6-s6jkp Pod was evicted by VPA Updater to apply resource recommendation.
76s Normal EvictedByVPA pod/hamster-5bccbb88c6-jc6gq Pod was evicted by VPA Updater to apply resource recommendation.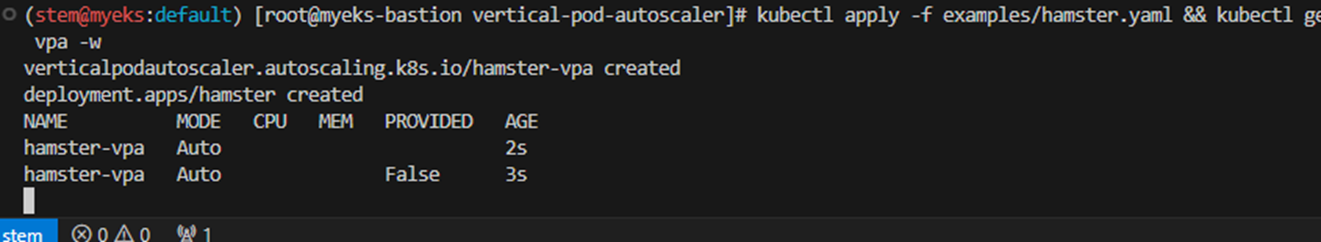


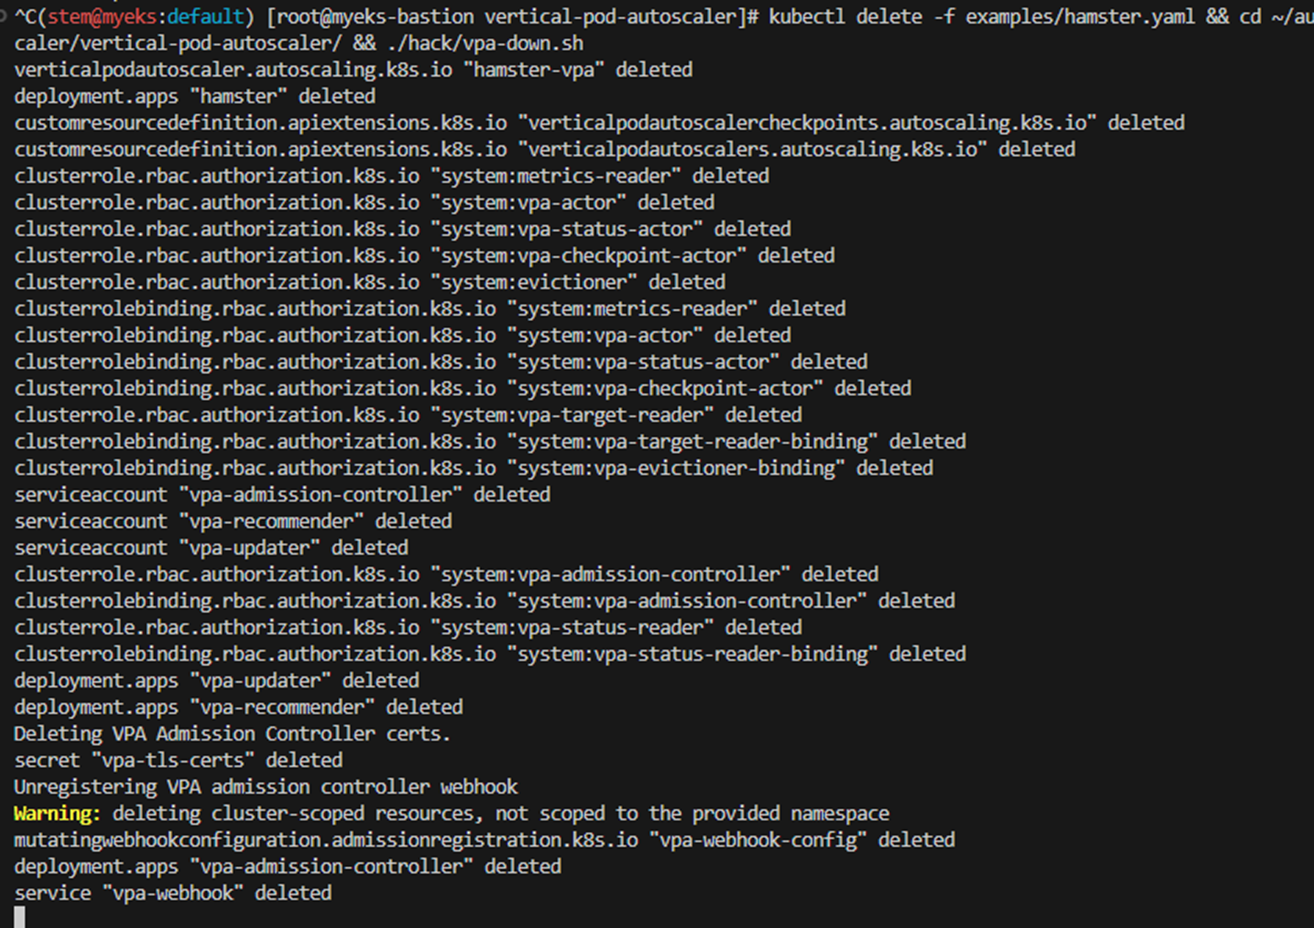
삭제: kubectl delete -f examples/hamster.yaml && cd ~/autoscaler/vertical-pod-autoscaler/ && ./hack/vpa-down.sh
5. 도전과제 - HPA : Autoscaling on multiple metrics and custom metrics
HorizonPodAutoscaler (줄여서 HPA) 는 워크로드 리소스(예:StatefulSet), 수요에 맞게 워크로드를 자동으로 확장하는 것을 목표로 합니다. 수평적 확장은 증가된 로드에 대한 대응으로 더 많은 로드를 배포하는 것을 의미합니다. 포드. 이는 Kubernetes의 경우 워크로드에 대해 이미 실행 중인 Pod에 더 많은 리소스(예: 메모리 또는 CPU)를 할당하는 것을 의미하는 수직적 확장 과 다릅니다 . 로드가 감소하고 포드 수가 구성된 최소값보다 높으면 HorizonPodAutoscaler는 워크로드 리소스(배포, StatefulSet 또는 기타 유사한 리소스)에 다시 축소하도록 지시합니다.
kubectl get hpa php-apache -o yaml > /tmp/hpa-v2.yaml


-----------------------------------------

apiVersion: autoscaling/v2
kind: HorizontalPodAutoscaler
metadata:
  name: php-apache
spec:
  scaleTargetRef:
    apiVersion: apps/v1
    kind: Deployment
    name: php-apache
  minReplicas: 1
  maxReplicas: 10
  metrics:
  - type: Resource
    resource:
      name: cpu
      target:
        type: Utilization
        averageUtilization: 50
status:
  observedGeneration: 1
  lastScaleTime: <some-time>
  currentReplicas: 1
  desiredReplicas: 1
  currentMetrics:
  - type: Resource
    resource:
      name: cpu
      current:
        averageUtilization: 0
        averageValue: 0
php-apache 서버 실행 및 노출
HorizonPodAutoscaler를 시연하기 위해 먼저 이미지를 사용하여 컨테이너를 실행하는 배포를 시작하고 위와 같은 매니페스트를 사용합니다

부하증가
다음과 같이 Auto-Scaler가 부하 증가에 어떻게 반응하는지 알 수 있습니다. 이를 위해 클라이언트 역할을 할 다른 Pod를 시작하고 클라이언트 Pod 내의 컨테이너는 무한 루프에서 실행되어 php-apache 서비스에 쿼리를 보냅니다.

CPU 사용량이 점점 늘어나며 , HorizonPodAutoscaler의 수치와 일치하는 복제본 수가 표시된 것을 볼 수 있습니다.

부하 생성 중지
위와 같이 로드 생성을 중지하고 , 이미지를 실행하는 Pod를 생성한 터미널에서 로드 생성을 종료합니다

6. Karpenter : K8S Native AutoScaler

Karpenter는 적시에 적절한 노드를 사용하여 Kubernetes 인프라를 단순화합니다. Karpenter는 클러스터의 애플리케이션을 처리하는 데 적합한 컴퓨팅 리소스를 자동으로 시작합니다. Kubernetes 클러스터에 대한 빠르고 간단한 컴퓨팅 프로비저닝을 통해 클라우드를 최대한 활용할 수 있도록 설계되었습니다.
Karpenter는 Apache License 2.0을 통해 라이선스가 부여되는 오픈 소스 프로젝트입니다. 모든 주요 클라우드 공급업체 및 온프레미스 환경을 포함하여, 모든 환경에서 실행되는 모든 Kubernetes 클러스터와 함께 작동하도록 설계되었습니다.
- Getting Started with Karpenter 실습 : Docs Intro : 복잡도를 줄이기 위해서 신규 EKS(myeks2) 환경에서 실습 진행 - TeamGithub Chart
- 실습 환경 배포(2분 후 접속) : myeks2
# YAML 파일 다운로드
curl -O https://s3.ap-northeast-2.amazonaws.com/cloudformation.cloudneta.net/K8S/karpenter-preconfig.yaml

# CloudFormation 스택 배포
예시) aws cloudformation deploy --template-file karpenter-preconfig.yaml --stack-name myeks2 --parameter-overrides KeyName=kp-gasida SgIngressSshCidr=$(curl -s ipinfo.io/ip)/32  MyIamUserAccessKeyID=AKIA5... MyIamUserSecretAccessKey='CVNa2...' ClusterBaseName=myeks2 --region ap-northeast-2

# CloudFormation 스택 배포 완료 후 작업용 EC2 IP 출력
aws cloudformation describe-stacks --stack-name myeks2 --query 'Stacks[*].Outputs[0].OutputValue' --output text

# 작업용 EC2 SSH 접속
ssh -i ~/.ssh/kp-gasida.pem ec2-user@$(aws cloudformation describe-stacks --stack-name myeks2 --query 'Stacks[*].Outputs[0].OutputValue' --output text)

- 사전 확인 & eks-node-viewer 설치
# IP 주소 확인 : 172.30.0.0/16 VPC 대역에서 172.30.1.0/24 대역을 사용 중
ip -br -c addr

# EKS Node Viewer 설치 : 현재 ec2 spec에서는 설치에 다소 시간이 소요됨 = 2분 이상
wget https://go.dev/dl/go1.22.1.linux-amd64.tar.gz
tar -C /usr/local -xzf go1.22.1.linux-amd64.tar.gz
export PATH=$PATH:/usr/local/go/bin
go install github.com/awslabs/eks-node-viewer/cmd/eks-node-viewer@latest

# [터미널1] bin 확인
cd ~/go/bin && ./eks-node-viewer -h

# EKS 배포 완료 후 실행 하자
cd ~/go/bin && ./eks-node-viewer --resources cpu,memory
- EKS 배포
# 변수 정보 확인
export | egrep 'ACCOUNT|AWS_' | egrep -v 'SECRET|KEY'
# 변수 설정
export KARPENTER_NAMESPACE="kube-system"
export K8S_VERSION="1.29"
export KARPENTER_VERSION="0.35.2"
export TEMPOUT=$(mktemp)
export ARM_AMI_ID="$(aws ssm get-parameter --name /aws/service/eks/optimized-ami/${K8S_VERSION}/amazon-linux-2-arm64/recommended/image_id --query Parameter.Value --output text)"
export AMD_AMI_ID="$(aws ssm get-parameter --name /aws/service/eks/optimized-ami/${K8S_VERSION}/amazon-linux-2/recommended/image_id --query Parameter.Value --output text)"
export GPU_AMI_ID="$(aws ssm get-parameter --name /aws/service/eks/optimized-ami/${K8S_VERSION}/amazon-linux-2-gpu/recommended/image_id --query Parameter.Value --output text)"
export AWS_PARTITION="aws"
export CLUSTER_NAME="${USER}-karpenter-demo"
echo "export CLUSTER_NAME=$CLUSTER_NAME" >> /etc/profile
echo $KARPENTER_VERSION $CLUSTER_NAME $AWS_DEFAULT_REGION $AWS_ACCOUNT_ID $TEMPOUT $ARM_AMI_ID $AMD_AMI_ID $GPU_AMI_ID
# CloudFormation 스택으로 IAM Policy, Role(KarpenterNodeRole-myeks2) 생성 : 3분 정도 소요
curl -fsSL https://raw.githubusercontent.com/aws/karpenter-provider-aws/v"${KARPENTER_VERSION}"/website/content/en/preview/getting-started/getting-started-with-karpenter/cloudformation.yaml > "${TEMPOUT}" \
&& aws cloudformation deploy \
--stack-name "Karpenter-${CLUSTER_NAME}" \
--template-file "${TEMPOUT}" \
--capabilities CAPABILITY_NAMED_IAM \
--parameter-overrides "ClusterName=${CLUSTER_NAME}"
# 클러스터 생성 : myeks2 EKS 클러스터 생성 19분 정도 소요
eksctl create cluster -f - <<EOF
---
apiVersion: eksctl.io/v1alpha5
kind: ClusterConfig
metadata:
name: ${CLUSTER_NAME}
region: ${AWS_DEFAULT_REGION}
version: "${K8S_VERSION}"
tags:
karpenter.sh/discovery: ${CLUSTER_NAME}
iam:
withOIDC: true
serviceAccounts:
- metadata:
name: karpenter
namespace: "${KARPENTER_NAMESPACE}"
roleName: ${CLUSTER_NAME}-karpenter
attachPolicyARNs:
- arn:${AWS_PARTITION}:iam::${AWS_ACCOUNT_ID}:policy/KarpenterControllerPolicy-${CLUSTER_NAME}
roleOnly: true
iamIdentityMappings:
- arn: "arn:${AWS_PARTITION}:iam::${AWS_ACCOUNT_ID}:role/KarpenterNodeRole-${CLUSTER_NAME}"
username: system:node:{{EC2PrivateDNSName}}
groups:
- system:bootstrappers
- system:nodes
managedNodeGroups:
- instanceType: m5.large
amiFamily: AmazonLinux2
name: ${CLUSTER_NAME}-ng
desiredCapacity: 2
minSize: 1
maxSize: 10
iam:
withAddonPolicies:
externalDNS: true
EOF
# eks 배포 확인
eksctl get cluster
eksctl get nodegroup --cluster $CLUSTER_NAME
eksctl get iamidentitymapping --cluster $CLUSTER_NAME
eksctl get iamserviceaccount --cluster $CLUSTER_NAME
eksctl get addon --cluster $CLUSTER_NAME
# default 네임스페이스 적용
kubectl ns default
# 노드 정보 확인
kubectl get node --label-columns=node.kubernetes.io/instance-type,eks.amazonaws.com/capacityType,topology.kubernetes.io/zone
# ExternalDNS
MyDomain=<자신의 도메인>
echo "export MyDomain=<자신의 도메인>" >> /etc/profile
MyDomain=gasida.link
echo "export MyDomain=gasida.link" >> /etc/profile
MyDnzHostedZoneId=$(aws route53 list-hosted-zones-by-name --dns-name "${MyDomain}." --query "HostedZones[0].Id" --output text)
echo $MyDomain, $MyDnzHostedZoneId
curl -s -O https://raw.githubusercontent.com/gasida/PKOS/main/aews/externaldns.yaml
MyDomain=$MyDomain MyDnzHostedZoneId=$MyDnzHostedZoneId envsubst < externaldns.yaml | kubectl apply -f -
# kube-ops-view
helm repo add geek-cookbook https://geek-cookbook.github.io/charts/
helm install kube-ops-view geek-cookbook/kube-ops-view --version 1.2.2 --set env.TZ="Asia/Seoul" --namespace kube-system
kubectl patch svc -n kube-system kube-ops-view -p '{"spec":{"type":"LoadBalancer"}}'
kubectl annotate service kube-ops-view -n kube-system "external-dns.alpha.kubernetes.io/hostname=kubeopsview.$MyDomain"
echo -e "Kube Ops View URL = http://kubeopsview.$MyDomain:8080/#scale=1.5"
# [터미널1] eks-node-viewer
cd ~/go/bin && ./eks-node-viewer --resources cpu,memory
# k8s 확인
kubectl cluster-info
kubectl get node --label-columns=node.kubernetes.io/instance-type,eks.amazonaws.com/capacityType,topology.kubernetes.io/zone
kubectl get pod -n kube-system -owide
kubectl describe cm -n kube-system aws-auth
# Karpenter 설치를 위한 변수 설정 및 확인
export CLUSTER_ENDPOINT="$(aws eks describe-cluster --name "${CLUSTER_NAME}" --query "cluster.endpoint" --output text)"
export KARPENTER_IAM_ROLE_ARN="arn:${AWS_PARTITION}:iam::${AWS_ACCOUNT_ID}:role/${CLUSTER_NAME}-karpenter"
echo "${CLUSTER_ENDPOINT} ${KARPENTER_IAM_ROLE_ARN}"
# EC2 Spot Fleet의 service-linked-role 생성 확인 : 만들어있는것을 확인하는 거라 아래 에러 출력이 정상!
# If the role has already been successfully created, you will see:
# An error occurred (InvalidInput) when calling the CreateServiceLinkedRole operation: Service role name AWSServiceRoleForEC2Spot has been taken in this account, please try a different suffix.
aws iam create-service-linked-role --aws-service-name spot.amazonaws.com || true
# docker logout : Logout of docker to perform an unauthenticated pull against the public ECR
docker logout public.ecr.aws
# helm registry logout
helm registry logout public.ecr.aws
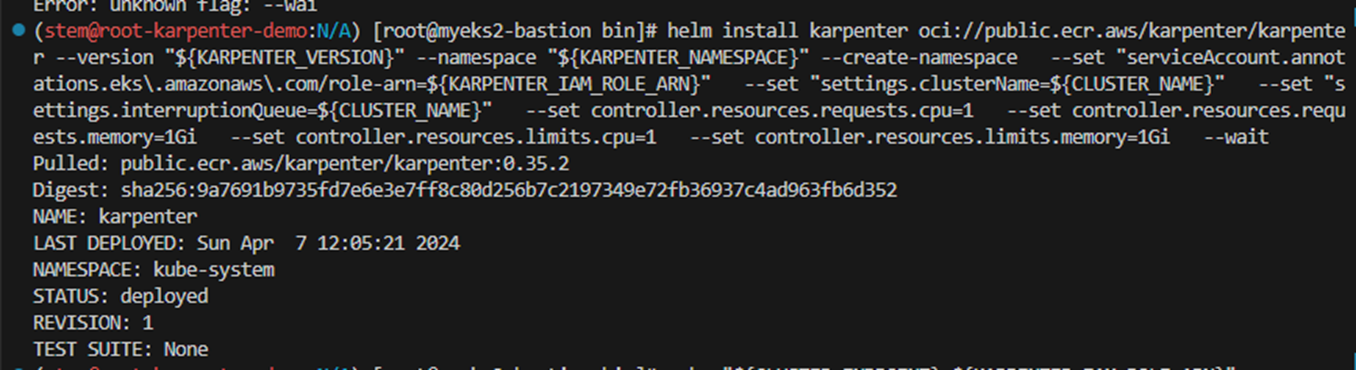
# karpenter 설치
helm install karpenter oci://public.ecr.aws/karpenter/karpenter --version "${KARPENTER_VERSION}" --namespace "${KARPENTER_NAMESPACE}" --create-namespace \
--set "serviceAccount.annotations.eks\.amazonaws\.com/role-arn=${KARPENTER_IAM_ROLE_ARN}" \
--set "settings.clusterName=${CLUSTER_NAME}" \
--set "settings.interruptionQueue=${CLUSTER_NAME}" \
--set controller.resources.requests.cpu=1 \
--set controller.resources.requests.memory=1Gi \
--set controller.resources.limits.cpu=1 \
--set controller.resources.limits.memory=1Gi \
--wait
# 확인
kubectl get-all -n $KARPENTER_NAMESPACE
kubectl get all -n $KARPENTER_NAMESPACE
kubectl get crd | grep karpenter
# APi 변경
v1alpha5/Provisioner → v1beta1/NodePool
v1alpha1/AWSNodeTemplate → v1beta1/EC2NodeClass
v1alpha5/Machine → v1beta1/NodeClaim


- Add optional monitoring with Grafana : 대시보드 - 링크 Link
#
helm repo add grafana-charts https://grafana.github.io/helm-charts
helm repo add prometheus-community https://prometheus-community.github.io/helm-charts
helm repo update
kubectl create namespace monitoring

# 프로메테우스 설치
curl -fsSL https://raw.githubusercontent.com/aws/karpenter-provider-aws/v"${KARPENTER_VERSION}"/website/content/en/preview/getting-started/getting-started-with-karpenter/prometheus-values.yaml | envsubst | tee prometheus-values.yaml
helm install --namespace monitoring prometheus prometheus-community/prometheus --values prometheus-values.yaml

# 그라파나 설치
curl -fsSL https://raw.githubusercontent.com/aws/karpenter-provider-aws/v"${KARPENTER_VERSION}"/website/content/en/preview/getting-started/getting-started-with-karpenter/grafana-values.yaml | tee grafana-values.yaml
helm install --namespace monitoring grafana grafana-charts/grafana --values grafana-values.yaml
kubectl patch svc -n monitoring grafana -p '{"spec":{"type":"LoadBalancer"}}'

# admin 암호
kubectl get secret --namespace monitoring grafana -o jsonpath="{.data.admin-password}" | base64 --decode ; echo

# 그라파나 접속
kubectl annotate service grafana -n monitoring "external-dns.alpha.kubernetes.io/hostname=grafana.$MyDomain"
echo -e "grafana URL = http://grafana.$MyDomain"


- Create NodePool(구 Provisioner) - Link Workshop
- 관리 리소스는 securityGroupSelector and subnetSelector로 찾음
- consolidationPolicy : 미사용 노드 정리 정책, 데몬셋 제외
cat <<EOF | envsubst | kubectl apply -f -
apiVersion: karpenter.sh/v1beta1
kind: NodePool
metadata:
  name: default
spec:
  template:
    spec:
      requirements:
        - key: kubernetes.io/arch
          operator: In
          values: ["amd64"]
        - key: kubernetes.io/os
          operator: In
          values: ["linux"]
        - key: karpenter.sh/capacity-type
          operator: In
          values: ["spot"]
        - key: karpenter.k8s.aws/instance-category
          operator: In
          values: ["c", "m", "r"]
        - key: karpenter.k8s.aws/instance-generation
          operator: Gt
          values: ["2"]
      nodeClassRef:
        apiVersion: karpenter.k8s.aws/v1beta1
        kind: EC2NodeClass
        name: default
  limits:
    cpu: 1000
  disruption:
    consolidationPolicy: WhenUnderutilized
    expireAfter: 720h # 30 * 24h = 720h
---
apiVersion: karpenter.k8s.aws/v1beta1
kind: EC2NodeClass
metadata:
  name: default
spec:
  amiFamily: AL2 # Amazon Linux 2
  role: "KarpenterNodeRole-${CLUSTER_NAME}" # replace with your cluster name
  subnetSelectorTerms:
    - tags:
        karpenter.sh/discovery: "${CLUSTER_NAME}" # replace with your cluster name
  securityGroupSelectorTerms:
    - tags:
        karpenter.sh/discovery: "${CLUSTER_NAME}" # replace with your cluster name
  amiSelectorTerms:
    - id: "${ARM_AMI_ID}"
    - id: "${AMD_AMI_ID}"
#   - id: "${GPU_AMI_ID}" # <- GPU Optimized AMD AMI
#   - name: "amazon-eks-node-${K8S_VERSION}-*" # <- automatically upgrade when a new AL2 EKS Optimized AMI is released. This is unsafe for production workloads. Validate AMIs in lower environments before deploying them to production.
EOF

# 확인
kubectl get nodepool,ec2nodeclass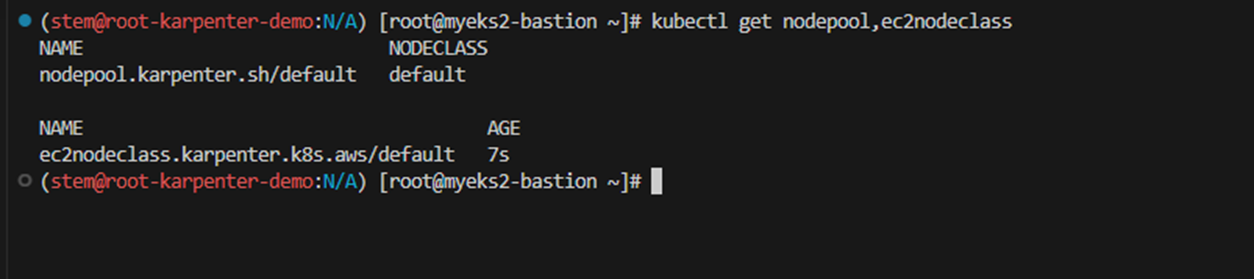
- Scale up deployment
# pause 파드 1개에 CPU 1개 최소 보장 할당
cat <<EOF | kubectl apply -f -
apiVersion: apps/v1
kind: Deployment
metadata:
  name: inflate
spec:
  replicas: 0
  selector:
    matchLabels:
      app: inflate
  template:
    metadata:
      labels:
        app: inflate
    spec:
      terminationGracePeriodSeconds: 0
      containers:
        - name: inflate
          image: public.ecr.aws/eks-distro/kubernetes/pause:3.7
          resources:
            requests:
              cpu: 1
EOF

# Scale up
kubectl get pod
kubectl scale deployment inflate --replicas 5
kubectl logs -f -n "${KARPENTER_NAMESPACE}" -l app.kubernetes.io/name=karpenter -c controller
kubectl logs -f -n "${KARPENTER_NAMESPACE}" -l app.kubernetes.io/name=karpenter -c controller | jq '.'
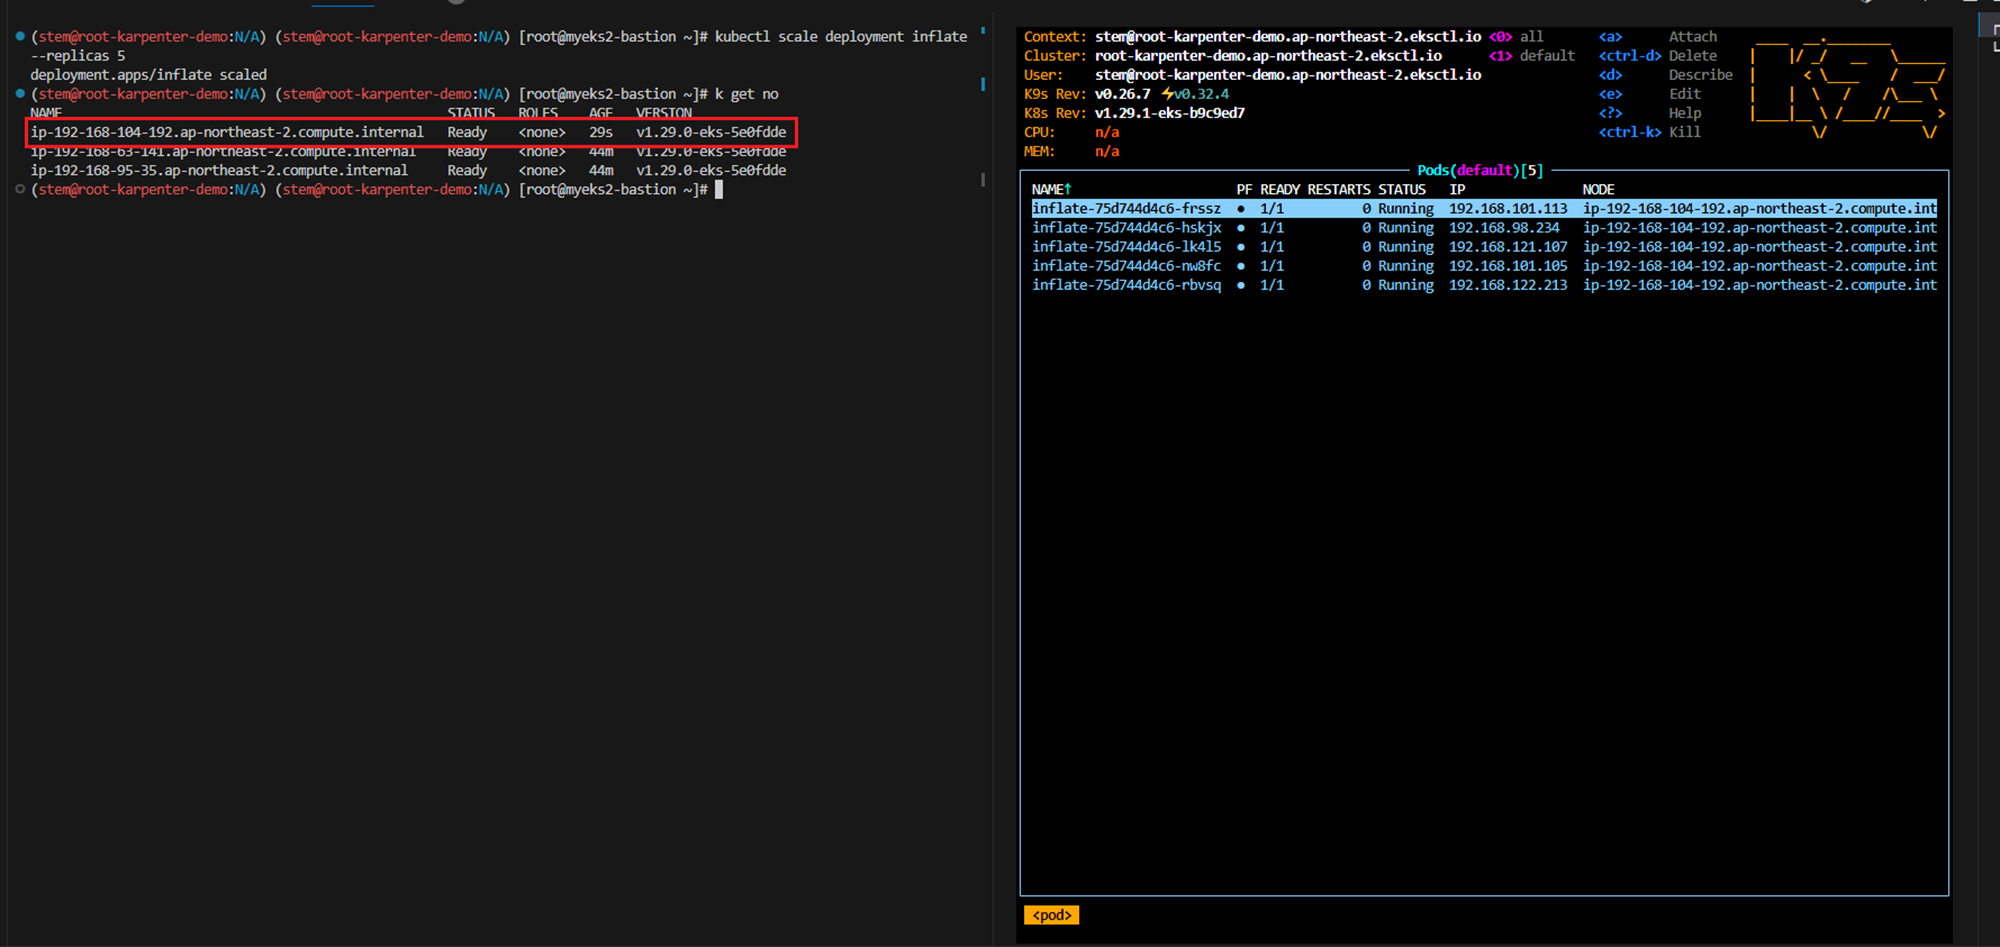
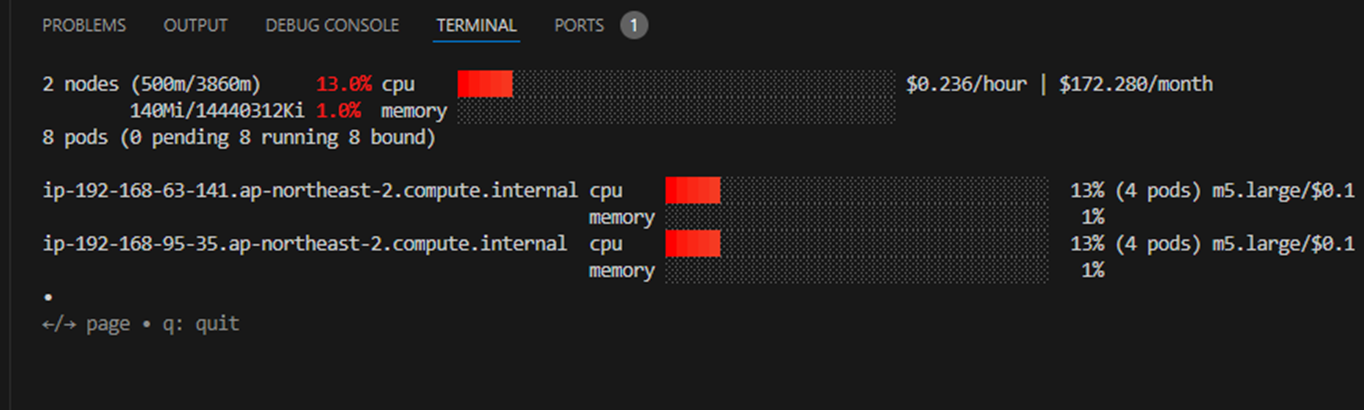
==> 약 30초 정도의 pending 후 , node가 scale out 되는 것을 볼 수 있음
- deployment 삭제
# Now, delete the deployment. After a short amount of time, Karpenter should terminate the empty nodes due to consolidation.
kubectl delete deployment inflate && date
kubectl logs -f -n "${KARPENTER_NAMESPACE}" -l app.kubernetes.io/name=karpenter -c controller
7. 실습 완료 후 리소스 삭제
# 클러스터 삭제
eksctl delete cluster --name "${CLUSTER_NAME}"

# 위 삭제 완료 후 아래 삭제
aws cloudformation delete-stack --stack-name myeks

삭제 소요시간은 대략 15분정도 걸리며, 아래와 같이 삭제된 것을 확인가능함.


#스터디 후기
EKS Autoscaling 스터디를 통해 클러스터 관리의 중요성을 인지하고 효율적인 관리를 통해 리소스 낭비, 성능 저하, 운영 비용 증가 등의 문제를 예방해야 한다는 것을 배웠습니다. 특히 HPA, VPA, karpenter 등 다양한 기능을 통해 클러스터 관리를 자동화하고 리소스 사용량을 최적화하는 여러 기능들을 새로 접했습니다. 앞으로도 지속적인 학습과 실무 적용을 통해 클러스터 관리를 더욱 효율적으로 수행하는 데 많은 도움이 될 것 같습니다.
'EKS Study' 카테고리의 다른 글
| 7주차 - EKS CI/CD (0) | 2024.04.14 |
|---|---|
| 6주차 - EKS Security (0) | 2024.04.13 |
| 4주차 - EKS Observability (1) | 2024.03.24 |
| 3주차 - EKS Storage & Nodegroup (1) | 2024.03.17 |
| 2주차 - EKS Networking (0) | 2024.03.10 |


